JEREMY HAYNES / PROJECT
National Park Passport
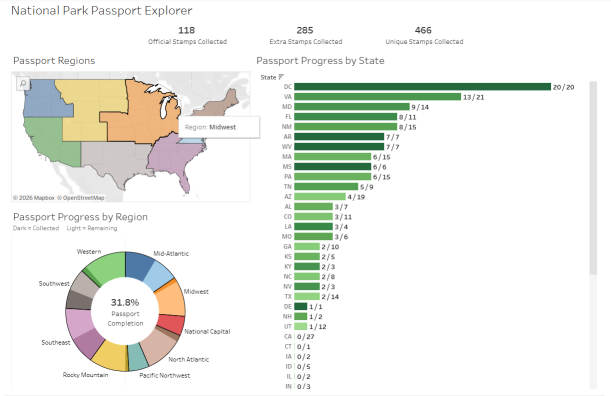
This personal Tableau project helps me track National Park Passport stamps and plan trips to collect the ones I am missing. It separates official stamp groups from additional stamps and organizes locations by state and region across the lower 48 states.
How the dashboard works
The overview shows collection progress by region and state, along with counts of unique stamps collected. A state detail view combines a map with a table of official stamp opportunities. Dashboard actions make it possible to move from the overall view to individual states and locations.
Data and design
The underlying data separates individual stamp records from distinct locations so that counts, maps and planning views operate at the appropriate level of detail. Official and additional stamps are tracked separately, and retired locations can be excluded when planning future trips.
I built the visualization as both a practical trip-planning tool and a personal Tableau project demonstrating dashboard design, geographic analysis, data modeling and interactive filtering.
View the visualization
View my Tableau Public profile or see more about my Tableau experience.