JEREMY HAYNES / EXPERIENCE
Operational Reporting & Analytics
For more than seven years, I developed reporting and analytics used to support day-to-day telecommunications operations. The work combined operational knowledge with business intelligence, using data from ticketing systems, network alarming and other operational sources to measure performance, identify trends and give leaders a clearer view of what was happening across the organization.
The reporting ranged from detailed operational reports used by managers and frontline teams to KPIs and executive-level reporting presented to senior leadership, including the CEO and other executives. The goal was not simply to build dashboards, but to turn operational data into information that people could use to make decisions.
Operational data
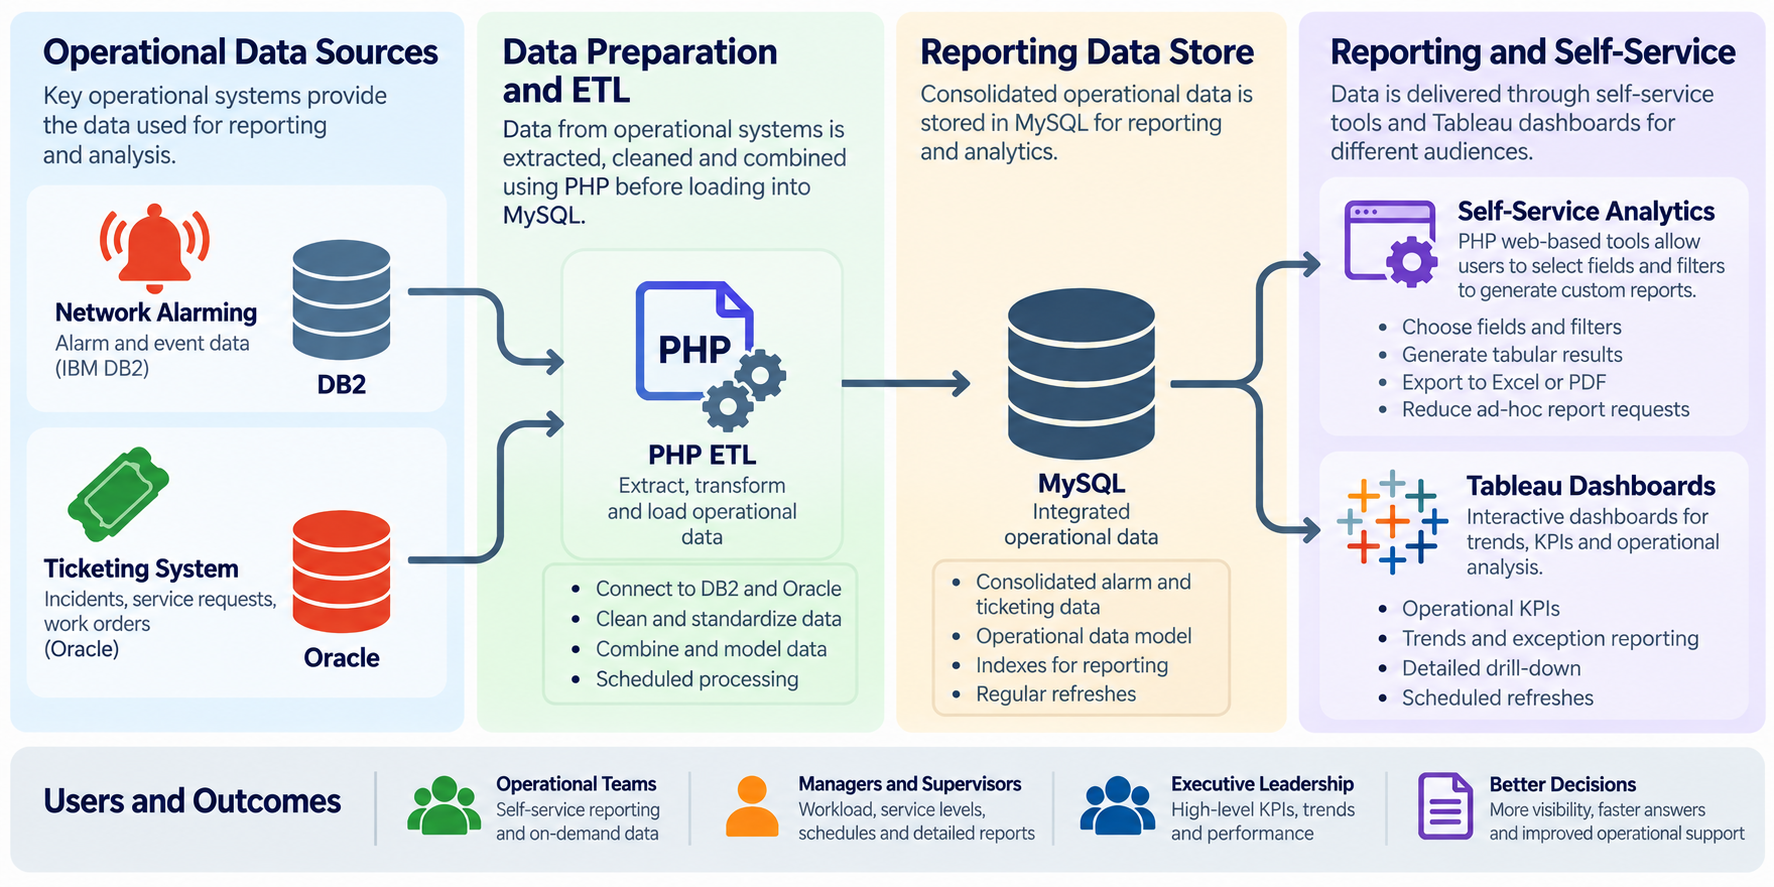
Much of the work began with data generated by the operation itself. Ticketing data provided information about workload, issue types, ownership, status, aging and resolution activity. Network alarming data provided another view of operational conditions and events. Bringing those sources into reporting made it possible to move beyond individual tickets or alarms and identify patterns across larger volumes of activity.
Because I had worked within network operations before moving into business intelligence, I understood both the technical data and the operational processes behind it. That context was important when defining metrics, validating results and determining whether a number accurately represented what was happening in the operation.
KPI development and performance reporting
I developed KPIs and recurring reporting to help leaders understand operational performance over time. That included defining how measures should be calculated, identifying the appropriate data, validating the results and presenting the information at a level appropriate for the audience.
Reporting could focus on workload, performance, service levels, trends, exceptions or other operational measures depending on the question being answered. The format also depended on how the information would be used: some situations benefited from dashboards and visual trend analysis, while others required detailed tables, schedules or records that managers could use directly.
Executive reporting
Operational analytics also supported reporting and presentations for senior leadership. I created and presented reporting for executive audiences, including the CEO and other executives, translating detailed operational activity into metrics and trends that could be understood without requiring the audience to work through the underlying technical data.
Executive reporting required a different level of communication than day-to-day operational reporting. The emphasis shifted from individual records and immediate workflow to significant trends, performance indicators, exceptions and the operational context behind the numbers.
Self-service analytics
Not every reporting request needed another static report. I also developed self-service reporting capabilities that allowed users to retrieve the information they needed without requiring a new report to be built for every variation of a question.
These solutions included web-based reporting tools that allowed users to select the fields they wanted, generate tabular results and export the output to formats such as Excel or PDF. This gave operational teams flexibility while reducing repetitive reporting requests and allowed the same underlying data to support different business needs.
Reporting built around the question
My approach to reporting has always started with understanding the problem someone is trying to solve. A dashboard is useful when the audience needs to identify trends, relationships or exceptions quickly. A detailed table can be better when someone needs exact records, schedules or values. Self-service tools make more sense when users need to answer many variations of the same question.
That experience shaped how I approach BI work today: understand the operational question first, understand the data behind it, and then choose the reporting method that best supports the decision.
Related: network operations background, data and analytics practice, Power BI and business intelligence, and all projects.